nfltr orch: A Visual User Guide
Every screenshot below is a real capture of nfltr orch and the hosted dashboard running against a live worker and relay — not a mockup. Follow along end to end: connect a worker, describe an objective, dispatch it, watch the run live, read the DAG and events, approve or reject, and collect the result.
1. Connect a worker and see the fleet
Orchestration needs at least one connected worker before you can dispatch anything. Start one with the labels your objective will target:
$ nfltr worker --labels nfltr.supports_task_mode.implement=true,nfltr.worker.tool=run_task,pool=dev \
    --mcp-command "nfltr claude-mcp --cwd ~/project --task-mode \${TASK_MODE}"
Confirm it is visible to the coordinator with fleet status:
$ nfltr orch fleet status
A ready worker shows 0/2 capacity used and a live heartbeat. If it never bootstraps, see Troubleshooting.
Not sure where to start? nfltr orch --help lists every command group by intent:
$ nfltr orch --help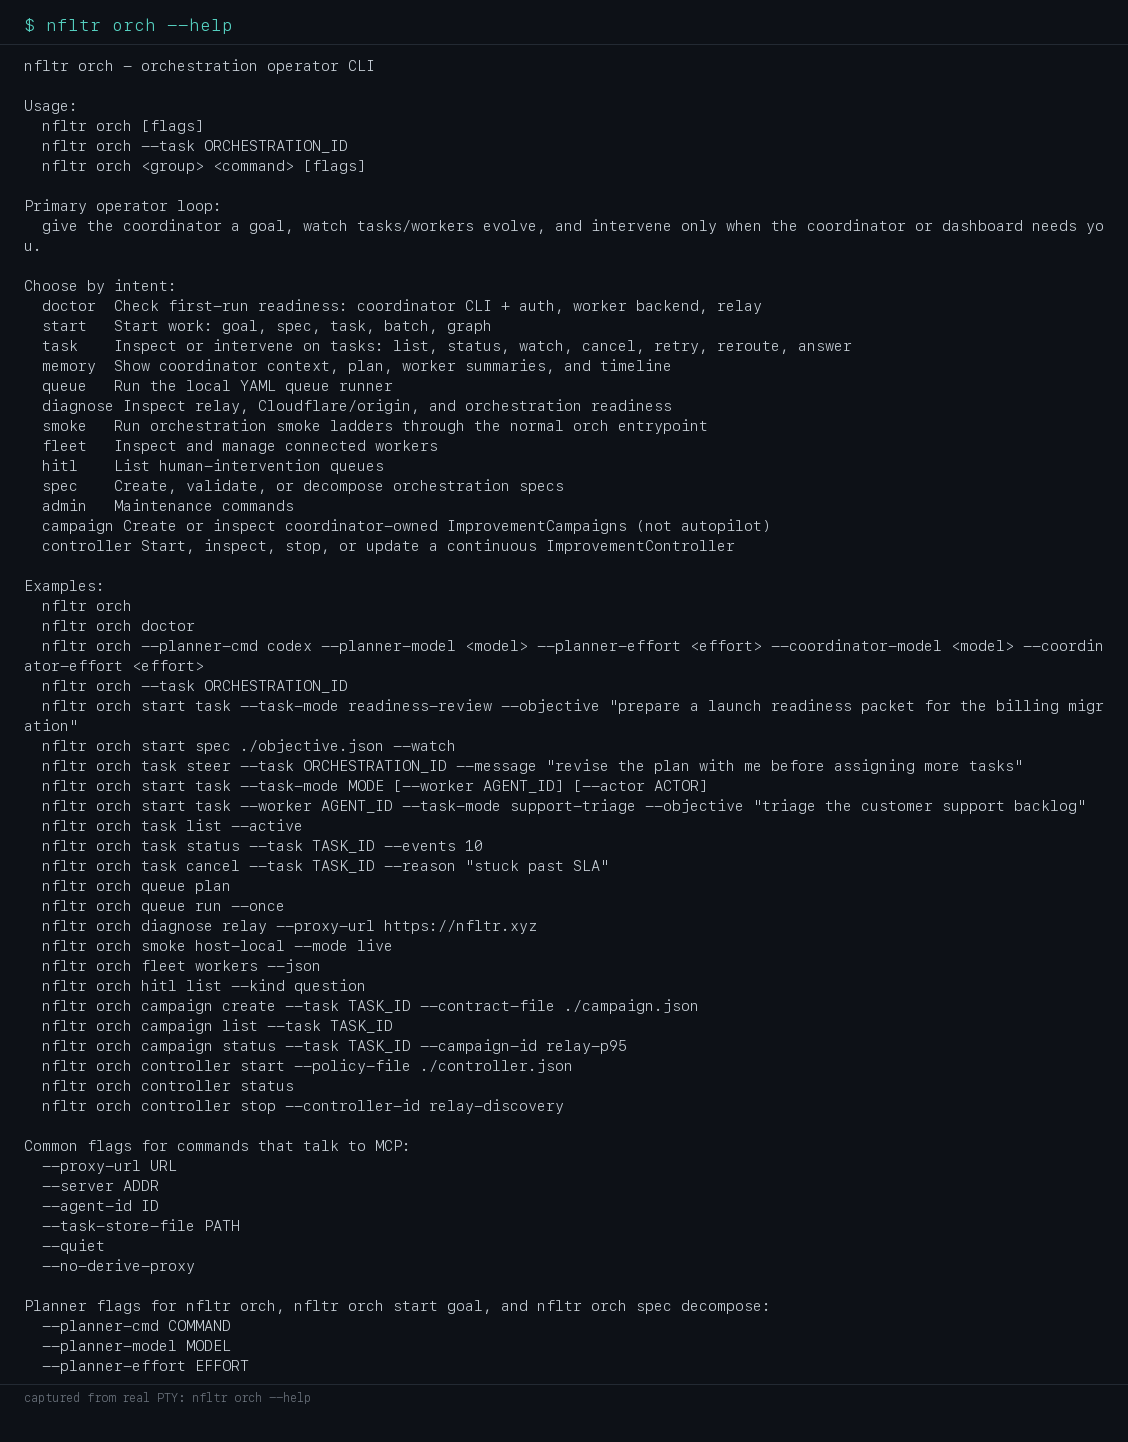
2. Describe an objective
An objective is a small JSON spec: one or more phases, each with a task_mode, a worker_label to target, and plain-English instructions. This is the exact spec used later in this guide:
{
  "objective": "Confirm the on-call workstation is ready to run orchestration tasks",
  "phases": [
    {
      "phase_id": "verify-toolchain",
      "task_mode": "verify-command",
      "worker_label": "flavor=generic",
      "mutates_workspace": false,
      "constraints": {
        "verification_commands": ["go version"]
      },
      "objective": "Verify the local Go toolchain is installed and reachable before larger orchestration runs are dispatched."
    }
  ]
}
Validate it before dispatching — this never talks to a worker, it only checks shape and references:
$ nfltr orch spec validate ./onboarding-check.jsonPrefer plain English? Let the planner draft the phase graph for you:
$ nfltr orch spec decompose --goal "Confirm the on-call workstation is ready to run orchestration tasks"3. Dispatch it and watch the run live
Dispatch the spec and tail every phase's lifecycle events until the whole graph reaches a terminal state:
$ nfltr orch start spec ./onboarding-check.json --watch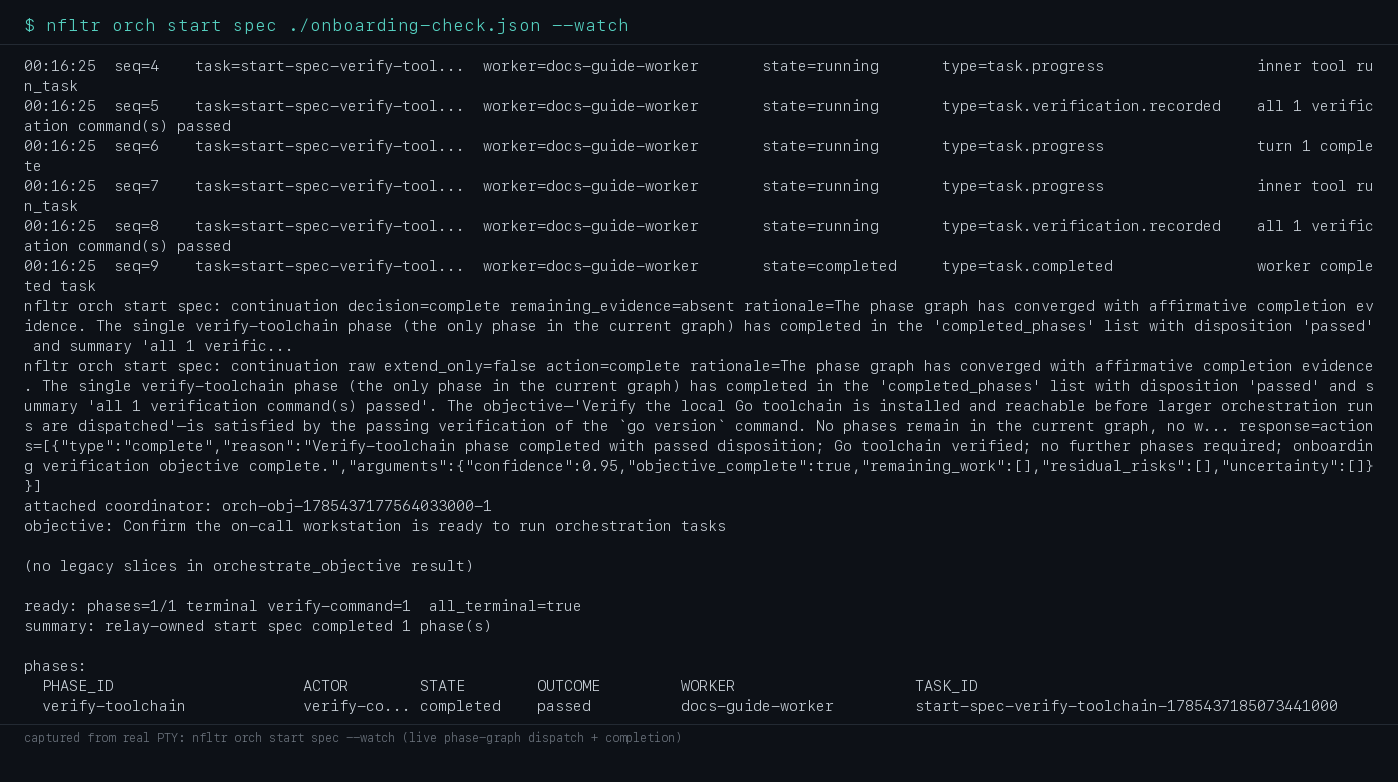
Each line is one lifecycle event: task.dispatched → task.accepted → task.progress → task.verification.recorded → task.completed. The closing table shows every phase's final state, outcome, worker, and task id.
4. Read the DAG and events on the dashboard
The same run mirrors onto the Causal Operations Atlas at nfltr.xyz/dashboard in real time — attention rail for human gates, causal canvas for run evidence, docked task drawer for one node, and Trace Lab when you expand a card for local Wasm timing analysis. Useful when you want a wider view than one terminal, or you're sharing the run with a teammate:
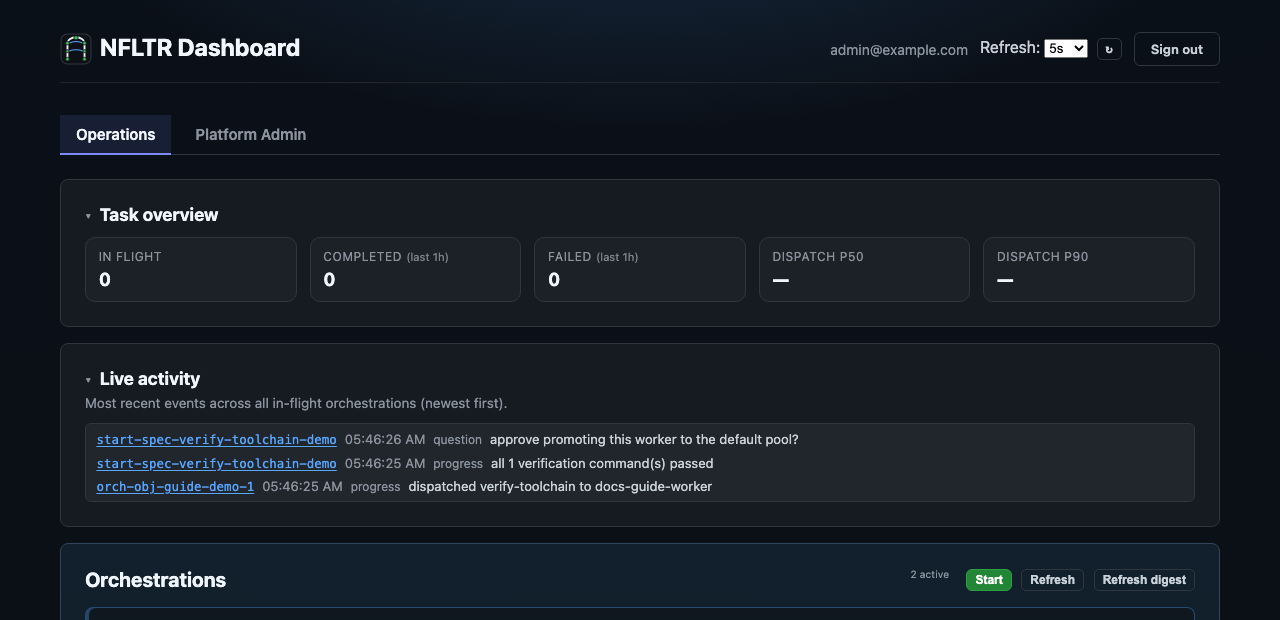
Atlas overview: the causal canvas summarizes live runs; the attention rail surfaces anything that still needs a human.
Each orchestration renders as a card with a DAG of coordinator and worker nodes — dependencies are drawn as edges, and each node's border color reflects its state. Click a node to open the docked task drawer:
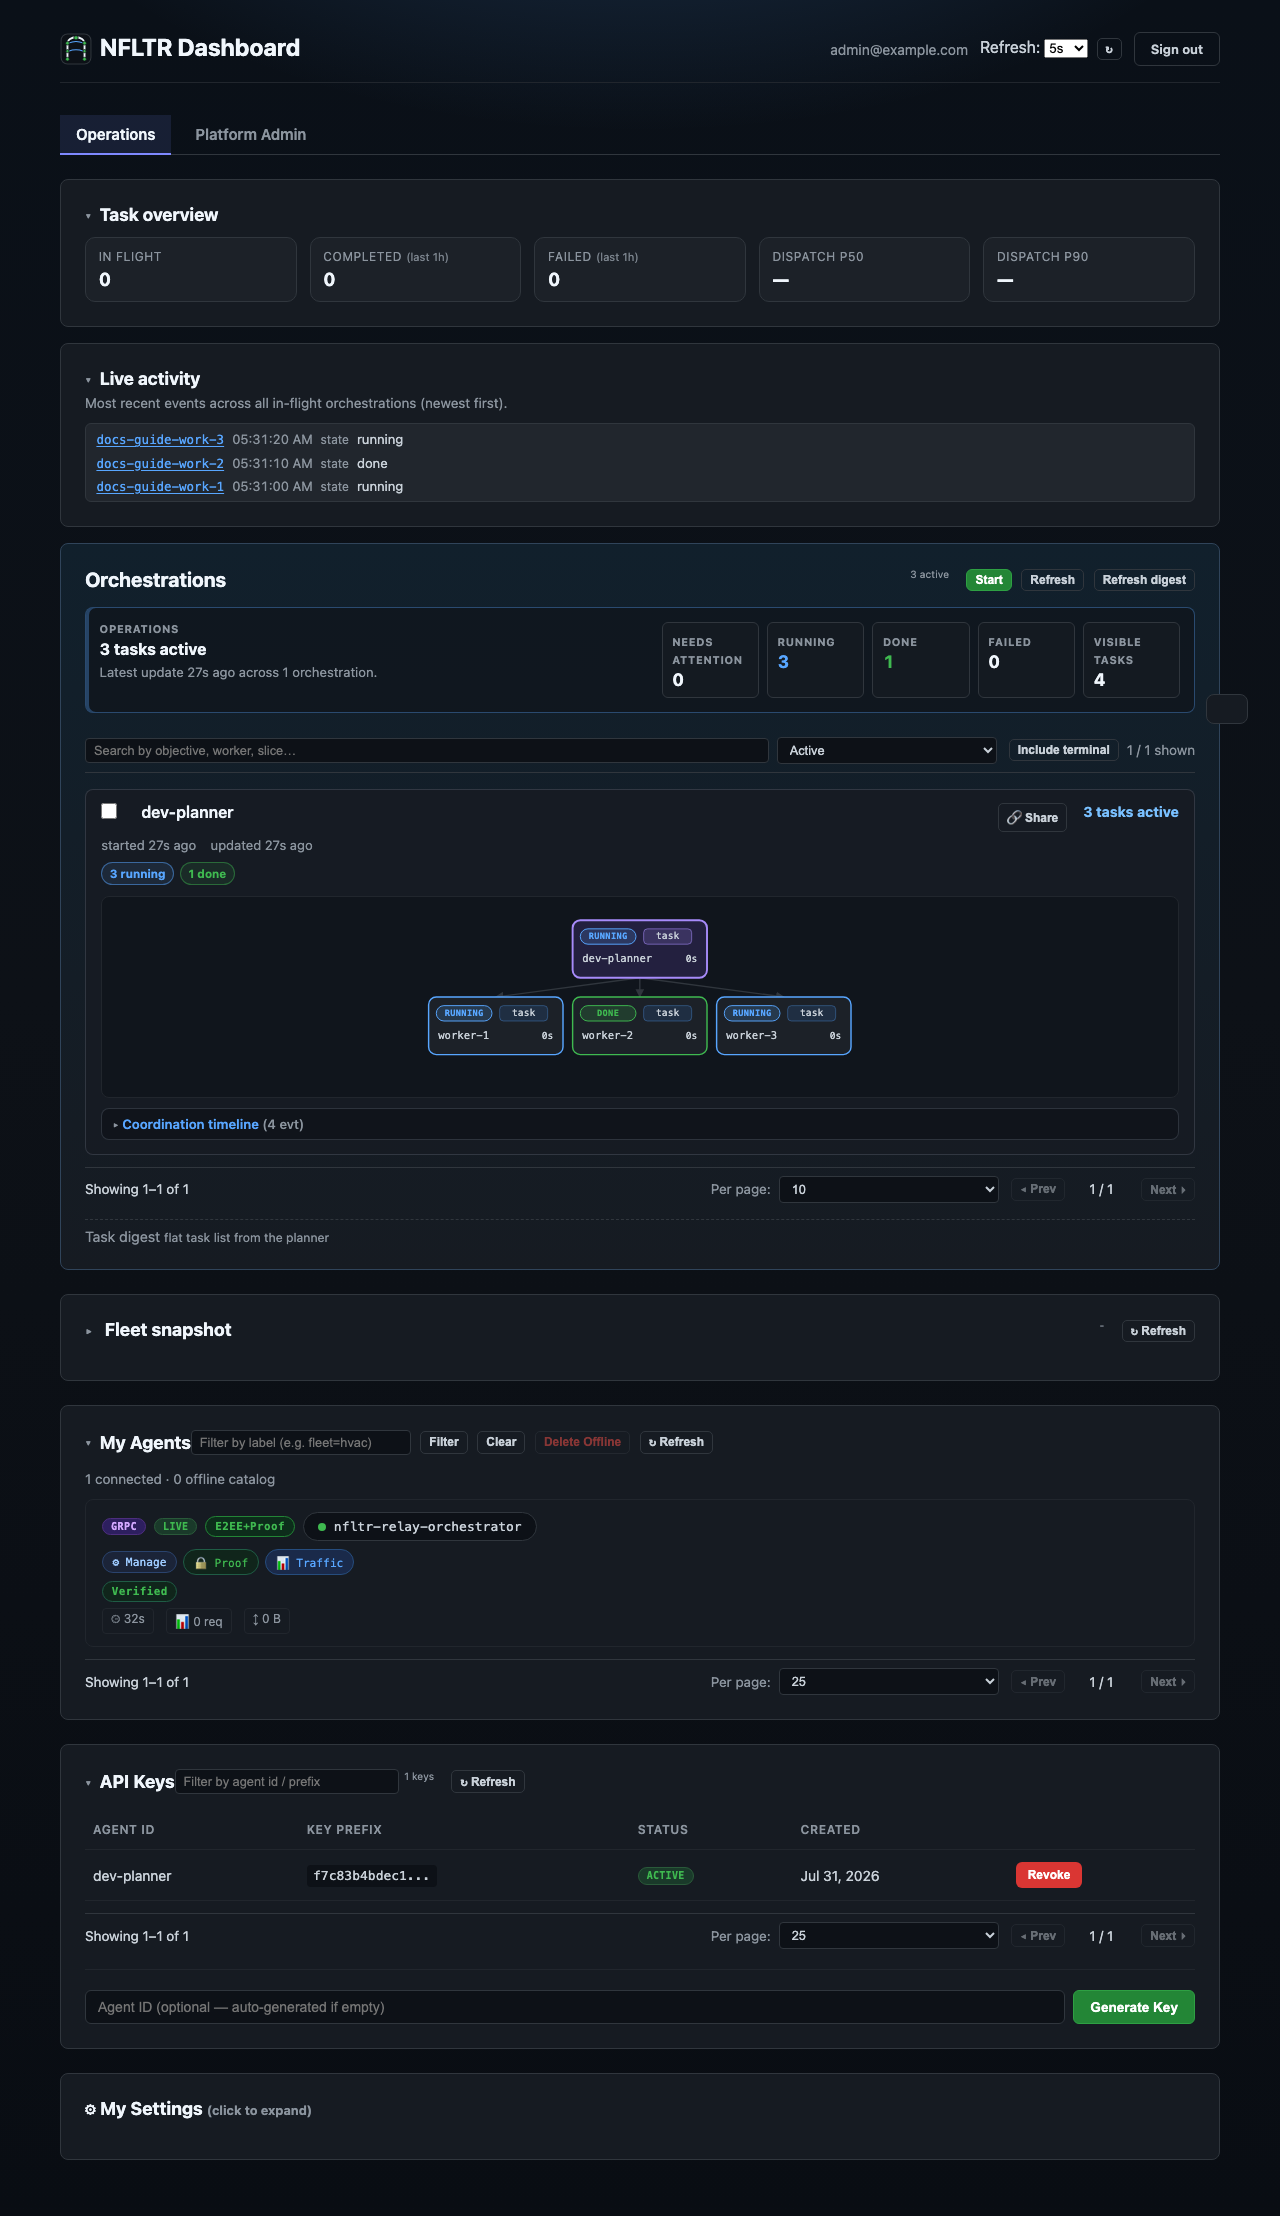
Causal canvas DAG: expand the card for Trace Lab wall-time and critical-path analysis; open a node for the task drawer.
The Activity disclosure lists the same events the CLI streamed, newest first, across visible orchestrations. It is an audit surface; live questions and approvals are promoted to the Needs you attention rail at the top of the workspace:

5. Approve or reject
When a phase's contract requires a human decision — a setup gate, a risky mutation, or a planner question — it appears in Needs you instead of being buried in the event feed. nfltr orch hitl --json is the matching CLI queue. Resolve a live gate from the terminal:
$ nfltr orch task approve --task TASK_ID --reason "verified evidence looks correct"$ nfltr orch task reject --task TASK_ID --reason "verification evidence is incomplete"$ nfltr orch task answer --task TASK_ID --message "proceed with the default pool"Or resolve the same live gate from the dashboard. Questions have an inline answer control; approvals open a focused decision drawer with the request and objective before technical detail. Terminal failed, cancelled, rejected, aborted, or completed tasks remain in History and never offer human-decision controls.
6. Collect the result
Once every phase is terminal, read the full event history and the recorded verification gate for any task id from the closing table:
$ nfltr orch task status --task TASK_ID --events 20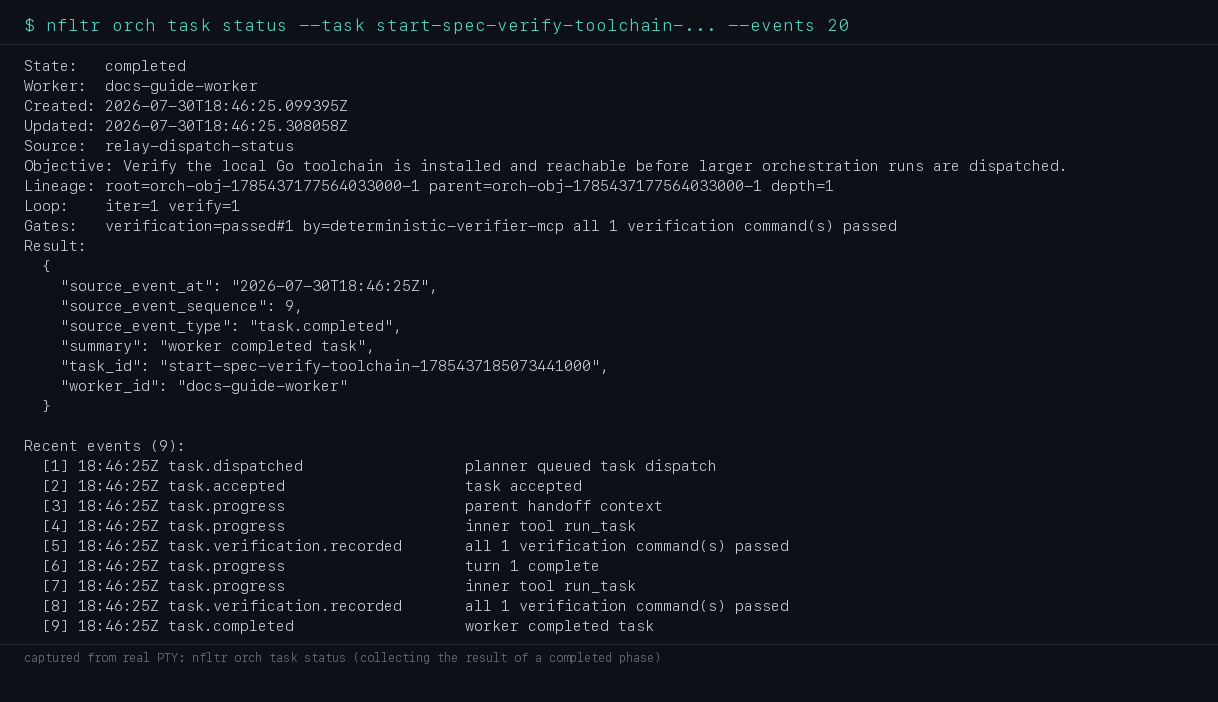
For scripting, task result prints just the structured result body — no event history:
$ nfltr orch task result --task TASK_IDNext
For inner-LLM turn detail, tool calls, and coordinator memory beyond what the task drawer shows, read Observe orchestration. For Wasm timing and critical-path analysis on the causal canvas, read Orchestration Trace Lab. For multi-worker fan-out patterns, see Multi-agent orchestration.